
🚨 Google’s Global Forest Map: Accidentally Reveals the Truth Behind China’s PM2.5 Haze Problem!
Google recently launched a new interactive map—“Global Forest Monitor (Global Forest Watch)“—that can display global forest coverage in real time. This map draws data from multiple sources, including NASA’s forest area coverage analysis data.
A netizen selected mainland China and surrounding regions on the map. After seeing it, the only feeling was that there’s nothing more sorrowful than sorrow.
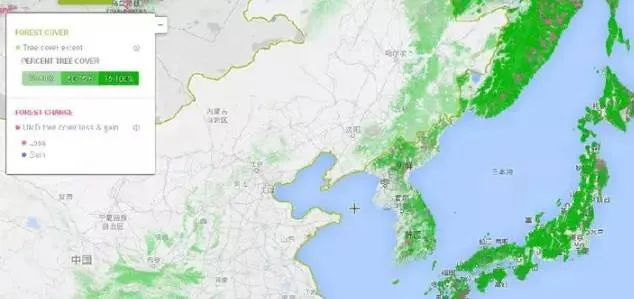
📋 Forest Coverage Color Standards
- Deepest green: Coverage of 75%-100%.
- Darker green: 50-75%.
- Light green: 25-50%.
- Gray: Coverage below 25%.
- Pink: Trees are decreasing.
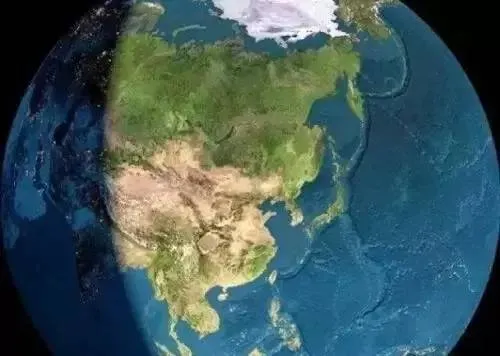
🗣️ Comparison Between Eurasia and Mainland China
This is the forest coverage map of Europe and Asia:
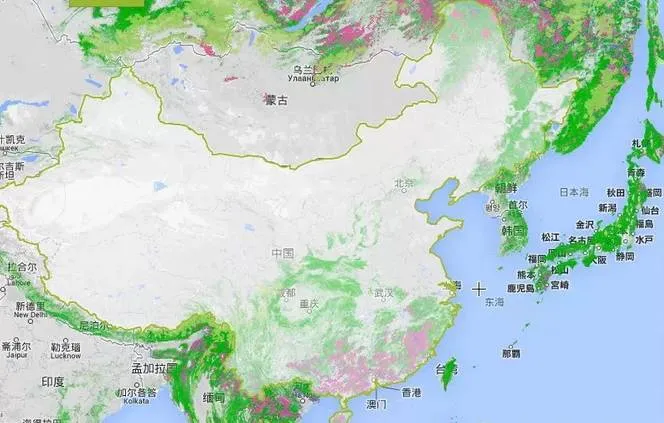
We’re surrounded!
🌛 Supplementary Note About Taiwan Island
2016.03.01 Supplement: Some netizens criticized the Taiwan Island in the above image being lush green as too fake. This is actually because Taiwan’s area relative to mainland is extremely small, and the western plains where large populations live only occupies a tiny portion of Taiwan’s land (meaning limited depth), creating a high-resolution deep-green color block tone.
Below is a large map of Taiwan island’s forest distribution, which should clearly show that green areas are quite densely distributed.
Okay, there’s a bit of green.
Zooming in further around Beijing:
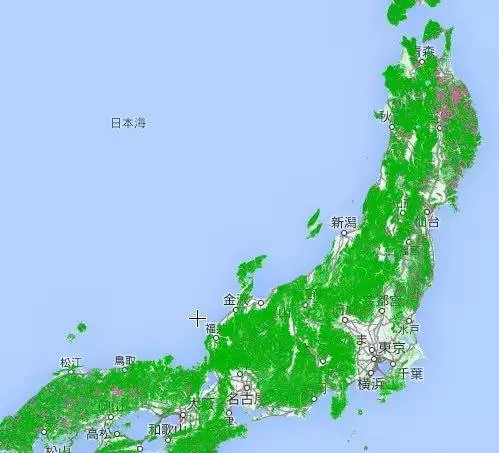
This is South Korea:
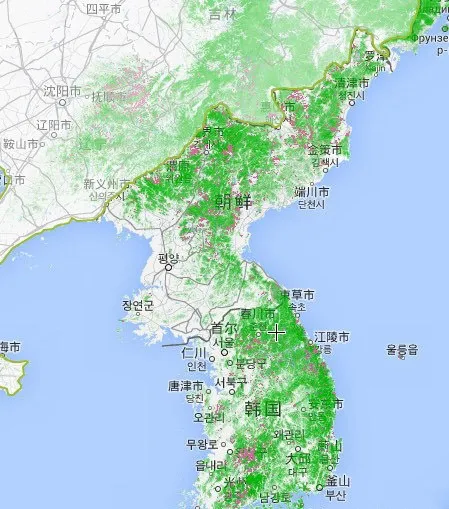
Notice how China’s neighbors—Japan and North/South Korea—have forests covering their eyes?
Russia as seen by Google satellite image is also a vast expanse of green.
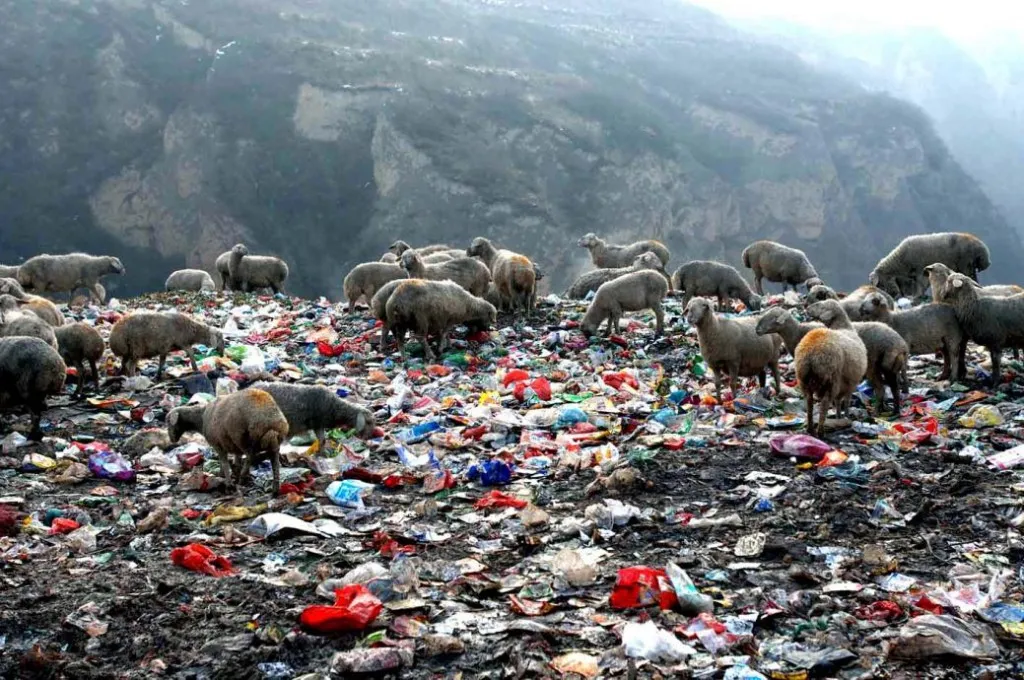
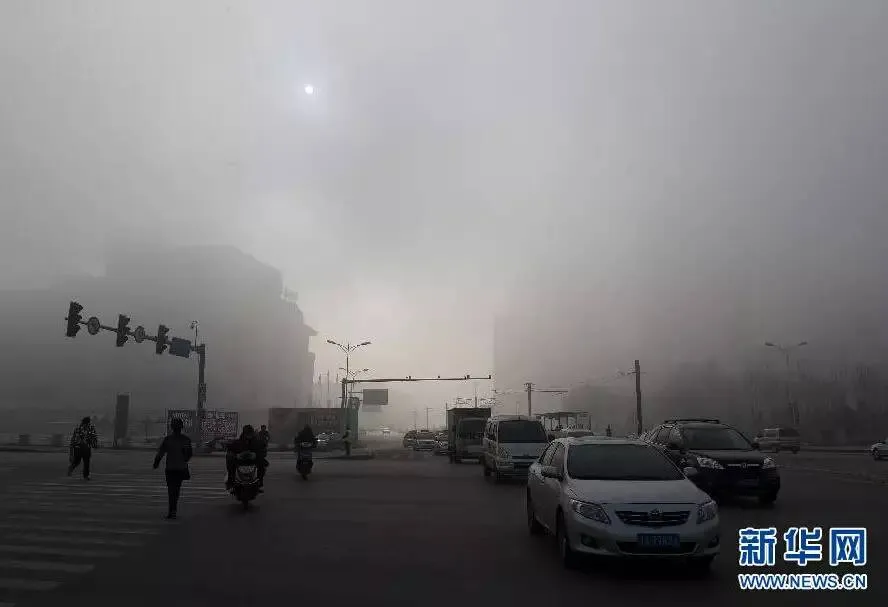
🏭 Environmental Destruction: Haze and Pollution Hellscape
This is exactly what we see in mainland cities:
Mainland China’s rivers:
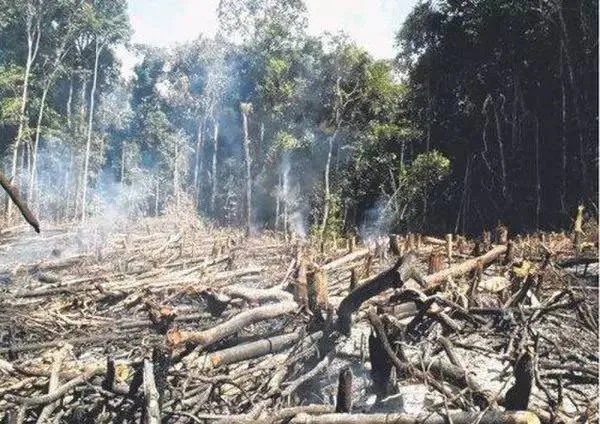
Waste smoke emitted by factories in mainland China:
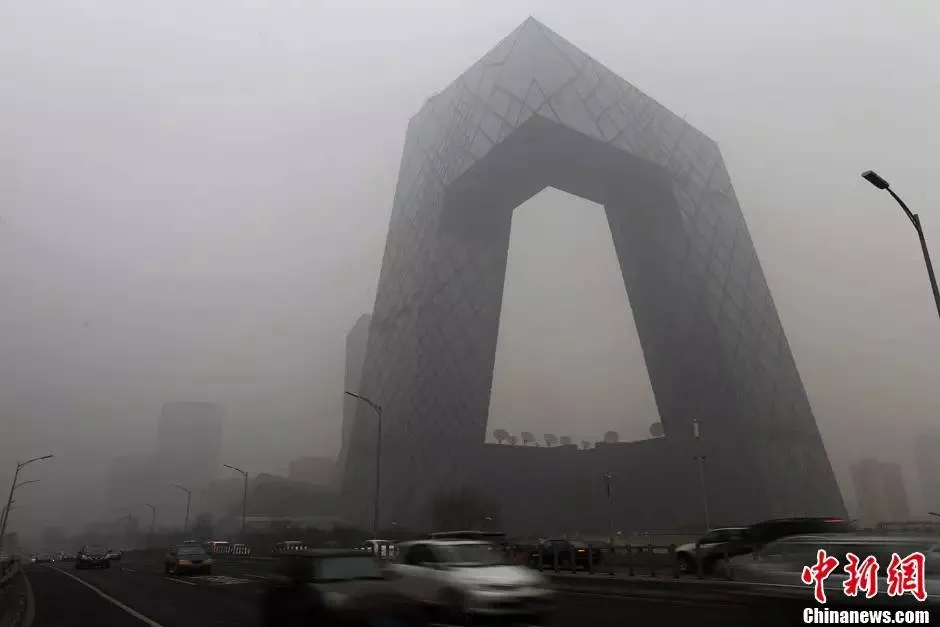
When altitude is sufficient enough, northern China looks like this:
This is the land where mainland Chinese people live today. If we continue to ignore environmental destruction’s reality, then we can only continue to be sad.